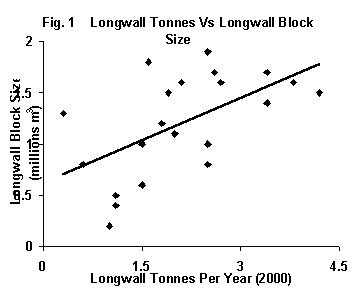
McAlpine-B research (see Graphic 1) shows that total production, as measured by longwall tonnes, and longwall block size is significantly correlated (longwall block size refers to the dimensions of the longwall ie height X width X length). This implies that some top producing mines have higher output not because of higher productivity levels, but rather because they have larger longwall block sizes. These mines produce more coal because they have higher seams and therefore produce more coal per shear and have fewer change outs because longwall blocks are longer, allowing more time to be dedicated to actual production.
|
|
McAlpine-B uses a measure called Standardised Longwall Output to adjust for the longwall block size factor. For example suppose a given longwall produces 2 million tonnes per year from an average longwall block size of 1 x million cubic metres (m3). What would this mine produce if the longwall block size were 2 million m3? SLO transforms a mine’s actual output (in tonnes) to a ‘standardized output’ ie the output the mine would have produced if it had a longwall block size the same as the largest mine in Australia. SLO is, in effect, a measure of overall mine productivity.
Five-Day Mines
Table 1 shows the rank ordering of ‘Top Producers’ Vs ‘Top SLO Producers’ (ie most productive mines using the SLO approach) for five-day mines in 2000. Note how different the results are. Wyee, ranked 19 in terms of ‘Top Producers’, is ranked number one by the SLO approach. This means that Wyee is the most productive five-day mine in Australia when longwall block size is controlled for.
Further analysis shows that there is a productivity gap of up to 30% between some ‘Top Producers’ and Top SLO Producers’. This is equivalent to some 1 million additional tonnes per year or $A40 million additional revenue per year (assuming a sale price of $US20 per tonne).
Seven-Day Mines
Table 2 shows the rank orderings for seven-day mines. Whilst Oaky North is the most productive mine it is only 3% more productive than Crinum. The differences between seven-day mines are not as great as for five-day mines because there is less variation in longwall block size (longwall block size for five-day mines varies by a factor of 7.5 but only a factor of 3.5 for seven-day mines).
Nonetheless, the average the top producing seven-day mine (as measured by the longwall output), has a productivity gap of about of 15% when compared to the top SLO mines. This represents an increase of about 600,000t per year or about $A24 million per year in additional revenue.
Conclusion
The SLO analysis shows that some of Australia’s ‘Top Producers’ are not as productive as they could be. The high production figures mainly reflect larger longwall block sizes. If ‘Top Producers’ could match the productivity of the ‘Top SLO Producers’, they could produce and additional 600,000-1 million tonnes per year. This means between $24 million and $40 million per year per mine.
McAlpine-B believes that the productivity gap is caused by low utilization and therefore suggests that mines with low SLO rankings in Tables 1 and 2 review respective utilisation rates.
McAlpine-B is a consulting firm specialising in utilization improvement in open cut and underground coal mines. Clients include BHP Coal, MIM, KPC and Wesfarmers Coal. For further information contact Graeme Baird, McAlpine-B Pty Ltd, 0419 340 747, mcalpine@ozemail.com.au


